The Late Show with Stephen Colbert called on Bannister Lake’s graphic integration services to generate key data-driven graphics during a live broadcast of the program on Showtime as mid-term election results were rolling in across the U.S. on Nov. 6.
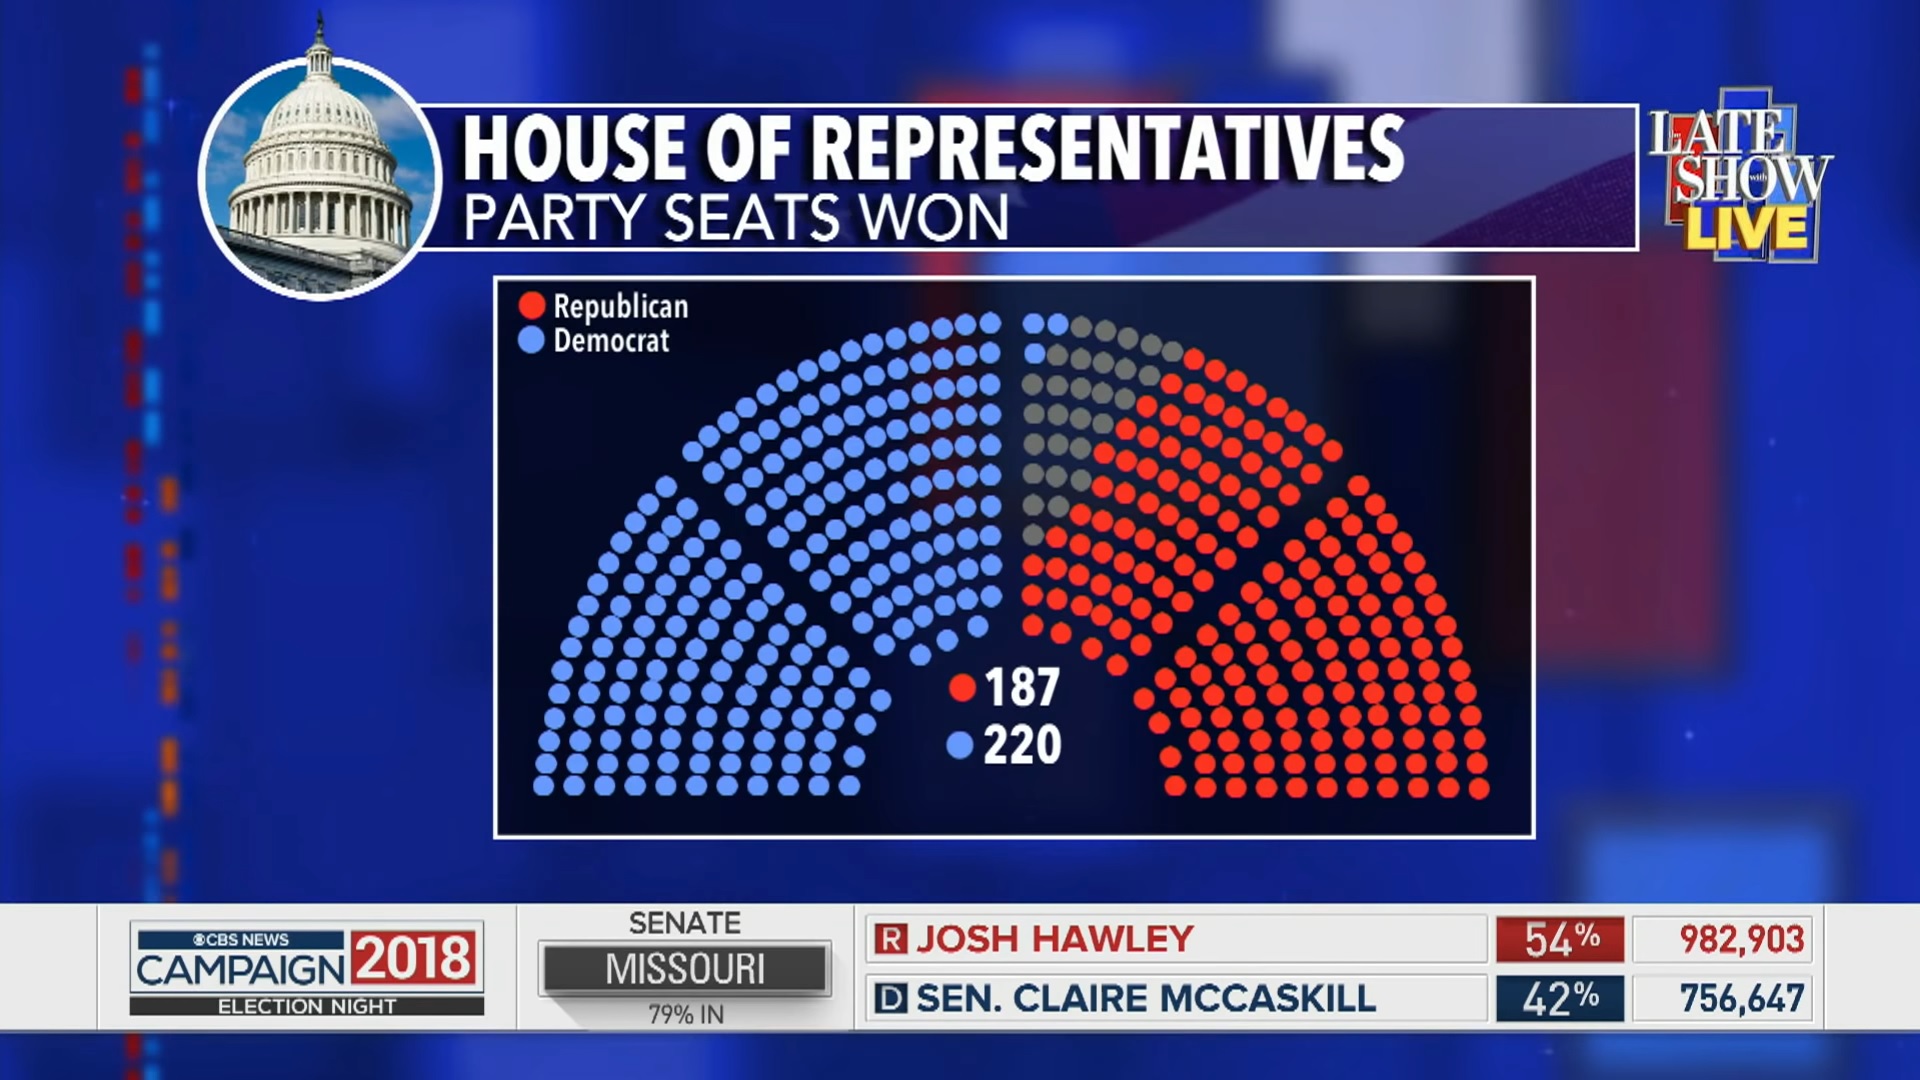
To help audiences visualize the unfolding results of the midterm elections, The Late Show with Stephen Colbert production team turned to Bannister Lake to prepare and integrate graphics into the live broadcast that showed the House of Representatives and the Senate populated with the number of elected officials.
The Late Show with Stephen Colbert used Google Sheets to tie data to the data-driven graphics and to manually make changes as required. During the election special, Bannister Lake’s role focused on transforming The Late Show’s creative graphic concepts into templates ready for playout.

The data-driven graphics work was performed by Bannister Lake creative and technical director Al Savoie and data integration was carried out by The Late Show’s production staff.
“Bannister Lake has a long-standing relationship with key members of the graphics team at The Late Show and when we were asked to help out with its election coverage, we immediately said yes,” said Savoie. [related]
“We have done countless election broadcasts integrating data and graphics, but we’re especially honored to have been chosen by The Late Show’s team and take part of midterm election history.”
Bannister Lake “provides software and services for managing and visualizing data for a broad range of projects including real-time election results, social media, financial information, sports, news, and weather,” according to the announcement.
Its flagship software solution, Chameleon, allows users to input any kind of data to populate and manage graphic templates. With Chameleon’s Google Sheets Custom Reader, media producers can automatically pull data content from Google Sheets cells and populate graphic templates.
In addition, producers are able to take advantage of Google Sheets’ sharing capabilities, granting access and editing rights to multiple users contributing to the content.
Data can be organized by topic and displayed using the Google Sheet tab, with Chameleon’s Google Sheets Custom Reader capable of handling multiple sheets and tabs to display complex broadcast data-driven graphics.
")