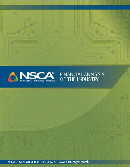
Did you know project backlog (unfinished work and sales orders that haven’t been fulfilled) among NSCA members has more than doubled since the 2015 NSCA Cost of Doing Business survey, from a median of $2 million to a median of $4.8 million?
Also, the percentage of revenue from recurring sales has been dropping since 2010, reaching a historical low point of 10.83 percent, according to the 2018 version of the NSCA survey.
The association’s 2018 Financial Analysis of the Industry report also indicates, however, that most profitable and top-quartile companies consistently rely on recurring revenue sales.
Other findings in this year’s survey include:
- “Video display/AV presentation and control” leads other options by a notable margin in terms of the system/technology that accounts for the largest share of total revenue in the last fiscal year.
NSCA executive director Chuck Wilson will dive deeper into the report during a webinar Tuesday, Dec. 4 at noon Eastern Time.
The webinar will help attendees “discover how to use the report to compare your company’s financial information with other integrators that run the same type of business you do,” according to the NSCA announcement.
“After the webinar is over, you’ll be able to identify areas in which you excel above industry averages, and areas where you’ve allowed expenses to increase well beyond the norm,” according to the NSCA press release.
More About NSCA’s Financial Analysis of the Industry
NSCA’s Financial Analysis of the Industry report helps integrators benchmark and compare expenses, profits, sales, and other data against industry peers of similar size and business focus.
It details the industry’s performance based on data collected from 100-plus integration firms that participated in the 2018 Cost of Doing Business survey earlier this year.
“This report offers a few interesting insights that we weren’t expecting,” says Wilson, NSCA executive director. “First, the industry is experiencing an increase in backlog, indicating that there’s plenty of work available. Profits are also up from the last report. [related]
Surprisingly, however, RMR revenue hasn’t increased. Many integrators are still struggling to get their managed services programs off the ground.”
The information in the Financial Analysis of the Industry “provides an in-depth look at integrator operations and dynamics, and helps NSCA members better understand the financial health of their own companies (and their firm’s performance compared to others).”
The report also includes verbatim responses about the biggest challenges integrators anticipate in future years.
The NSCA Financial Analysis of the Industry is free for Gold and Platinum NSCA members. Members who completed the Cost of Doing Business survey receive a customized copy of this report with additional information and insight exclusively for their organizations.
The report can be purchased by non-members for $399, or non-members can become NSCA members for only $595 and receive the report as part of their membership.


